Charts are one of the most prominent and valuable tools used by traders in binary options trading to predict future price movements based on historical trends. Technical analysis is the name given to this type of analysis, and because of its widespread use, most trading platforms include a variety of technical analysis tools.
Binary options, in general, are short-term investments that demand study and technical analysis. As a result, understanding and analyzing binary options charts is critical to any trader’s performance. It will be difficult to be profitable without a thorough understanding of chart reading and technical analysis. These trading charts do not have to be daunting, and understanding how to use charts to benefit your entire trading strategy and can help you become a successful trader.
Technical and Fundamental Analysis are two major areas of study in financial analysis. Regardless of whether one is more profitable than the other, they both have one common element: charts. Fundamental analysts, on the other hand, utilize charts less than technical analysts, and without a chart, every trader remains clueless.
However, Binary Options charts appear to be the least of the brokers’ concerns, and all they have to give us is a poor and ineffective charting software.
Types of charts
What you will read in this Post
Prices of assets were represented on paper printed by ticker-tape machines in the early days of trading, and investors read the tape to gain a sense of the market’s direction; if they wanted a chart, they had to design it themselves. This method of trading is known as “tape reading.” But as technology advanced, so did trading, computerized charts emerged. People began to recognize that prices formed patterns and that chart patterns might be predicted when this occurred.
Let’s take a closer look at the three kinds of charts:
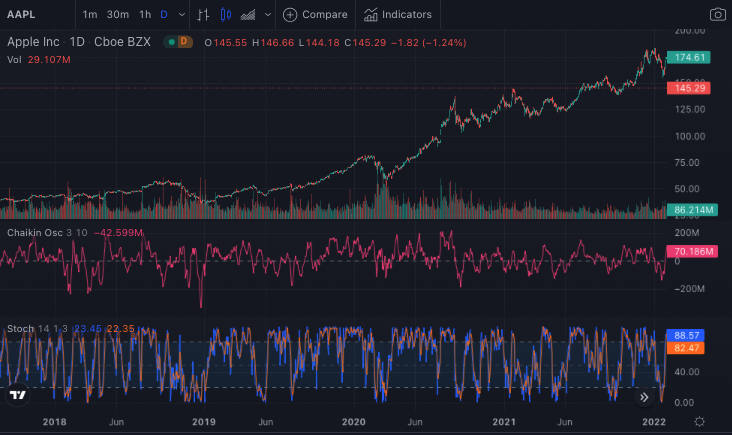
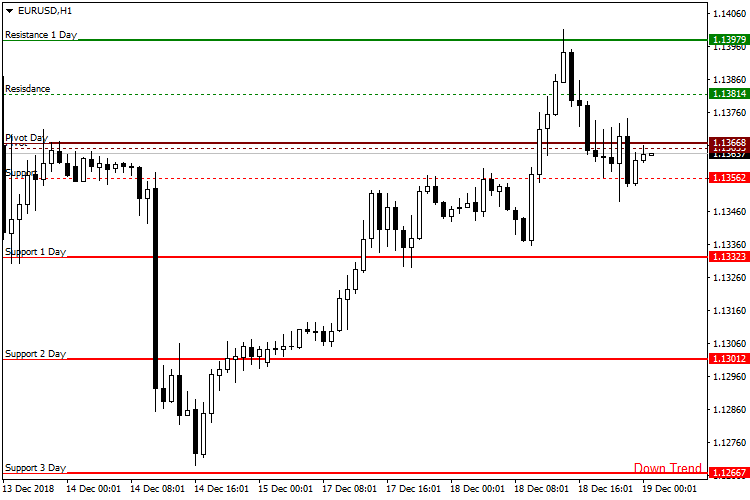
#1 Bar charts or OHLC
An OHLC chart is a form of bar chart that displays each period’s open, high, low, and closing prices. OHLC charts are valuable because they display the four primary data points throughout time, with many traders considering the closing price to be the most relevant.
This chart format is helpful because it can depict rise and fall momentum. If the opening and closing are far apart, it indicates strong momentum, while when they are close together, it indicates weak momentum. The high and low points represent the entire price range of the period, which is useful for determining fluctuation. On OHLC charts, traders look for several patterns.
Any time window can be used with OHLC charts. When added to a 5-minute chart, the open, high, low, and close prices for each 5-minute period will be displayed. It will display the open, high, low, and close prices on day to day basis once you apply them to a daily chart.
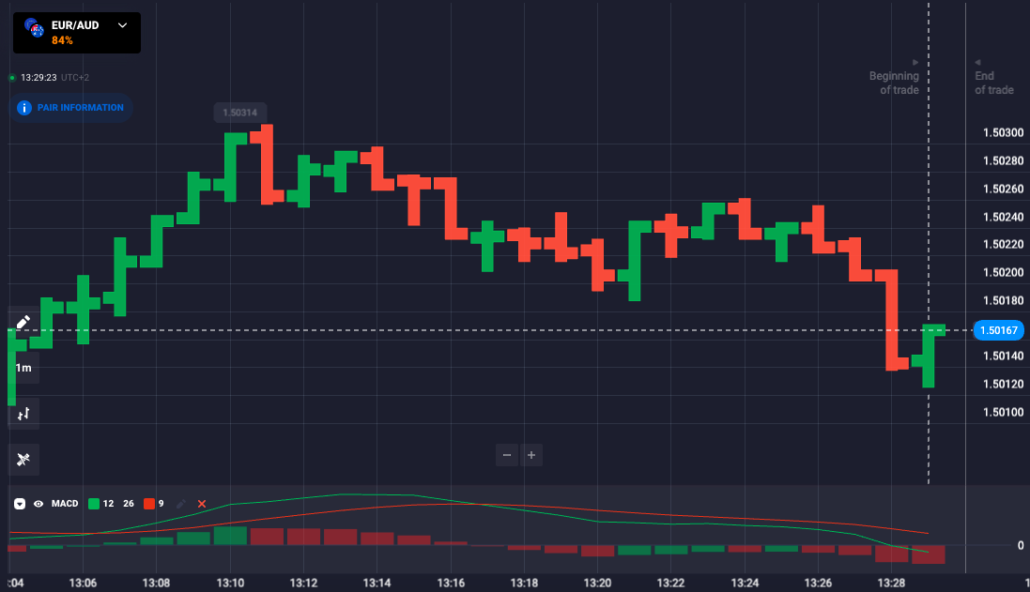
#2 Candlestick charts
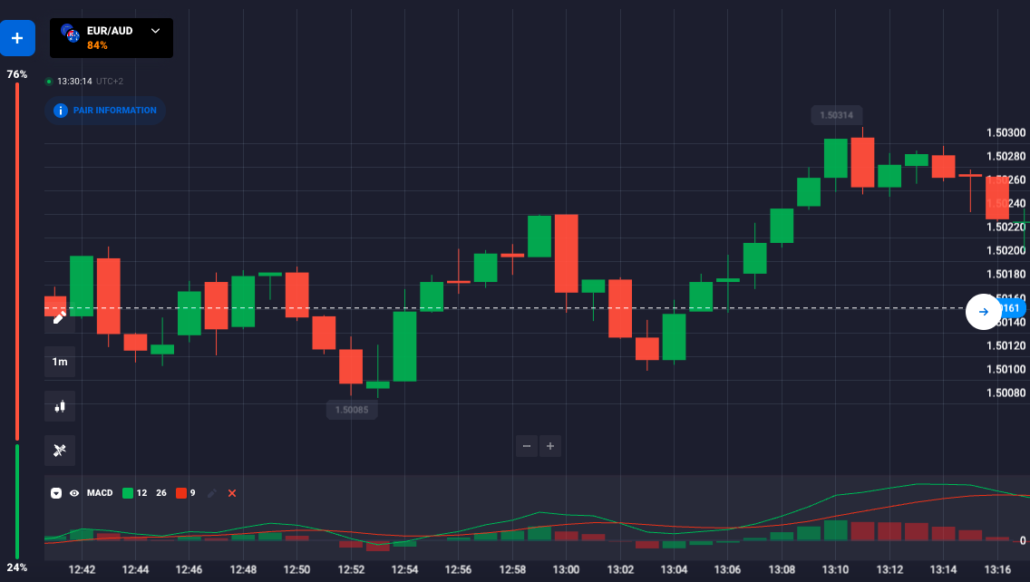
One of the most popular chart types is Japanese Candlesticks. The charts present a vast quantity of data in a very graphic form, allowing traders to see possible trading signals or patterns quickly. Many inexperienced traders who are new to the trading sector focus on candlesticks since they are simple to understand and offer the impression of actual trading. But it’s also true that no one has ever made money solely by trading candlestick patterns.
Many beginner traders are ecstatic because they get fantastic profits using candlestick patterns without spending much time reading about trading at first. Still, they eventually fail and return to learn more.
Candlesticks are a form of a chart that displays the price of an asset at its high, low, open, and close, etc., and swiftly indicating whether the asset ended higher or lower across a particular period by offering an incredibly simple, clear market analysis.
Candlesticks have a long and rich history dating all the way back to the medieval rice markets of ancient Samurai-ruled Japan. You can use them for all timespans – from one-minute charts to weekly and annual charts. When data is presented in this manner, it is typically easier to perform analysis and spot trade indications compared to other types of charts.
#3 Line charts
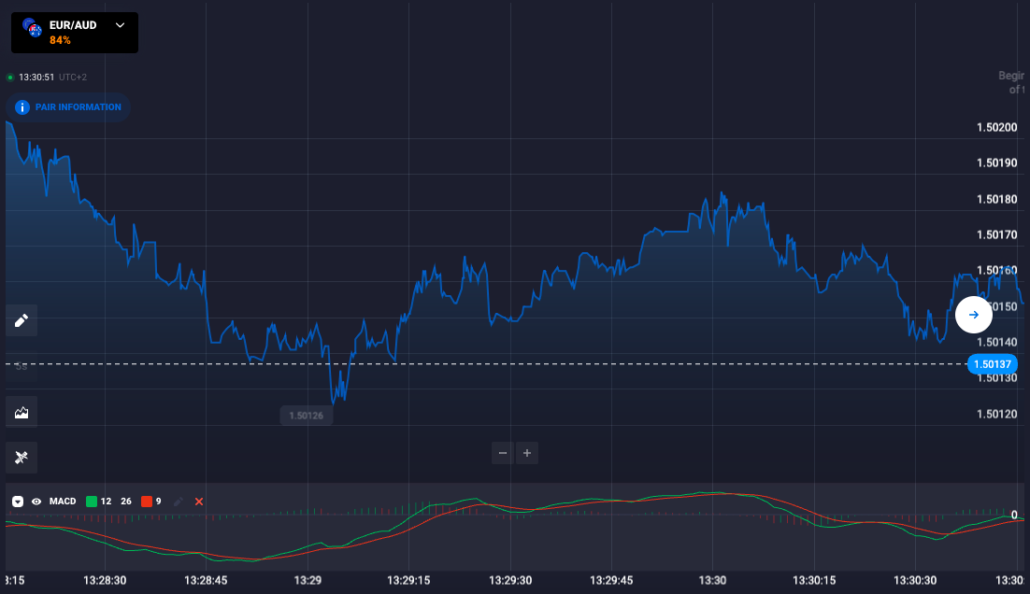
This is the most basic sort of chart, which depicts price change as a horizontal line. It doesn’t give accurate information regarding open, close, high, or low, and it doesn’t illustrate what happened over a specified period of time. For example, if you use a one-hour candlestick chart or an OHLC chart, you can see how the price changed during each hour, whereas a Line chart does not. Regrettably, this is the most prevalent Binary Options chart, and most brokers use it to display quotations to us.
(Risk warning: Your capital can be at risk)
Available Chart Sources
There are two types of chart sources:
#1 Downloadable Charts
These charts can be downloaded as an element of forex trading platforms or as stand-alone software plug-ins, as the name suggests. They are the best for asset analysis in binary options trading because they include numerous tools that enhance the analysis results. For binary options analysis, they are the chart program that is suggested.
Some chart sources provide their charting tools available for free. A few are free but require purchased plug-ins to function, and others that come as part of a comprehensive package that must be fully paid. The following are some of the charting sources for downloadable forex charts that are used in binary options analysis:
- MetaTrader4 Charts
This platform is accessible through practically every market maker broker in the FX market. There are a few that are worth a mention because they have a more diverse asset base that complements the binary options asset indexes.
The MetaTrader4 platform is perhaps the best source for free charting data and live charts.
You should preferably download the MT4 platform of a broker that offers more than 40 currency pairings, all major stock indexes (or at least eight), spot metals, and stocks.
- MultiCharts

In collaboration with TradingView, Multicharts is a charting package that allows you to download high-definition FX charts for 30 various currency pairings. A web-based version of the charts is also available. You can choose from a variety of time frames ranging from one minute to one month.
The MultiChart charting and trading platform, created by MCFX, is a reliable package that includes a special ODM chart trading function. This chart helps you by providing the actual asset price you want to trade on, labels it, and utilizes this data to notify you about the trade when it has lag time in both trade operation and signal generation.
- Interactive Brokers Information Systems (IBIS)
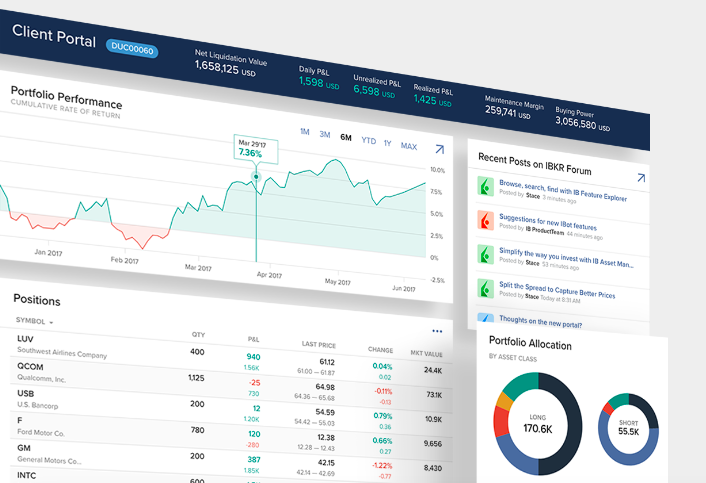
The term “interactive” in the name of this broker explains it all. Interactive Brokers provides one of the most complete technical analysis charting systems. The Interactive Brokers Information System technology allows charting at the organized level. IBIS’ charting features include:
- 22 customizable technical indicators.
- An alert tool that allows you to create alerts.
- The ability to utilize any of the three chart styles (bar chart, candlesticks, or line charts).
However, the bundle is not free. You must pay a monthly subscription fee of $69 to access it.
- Forex Charts Widget v1.7
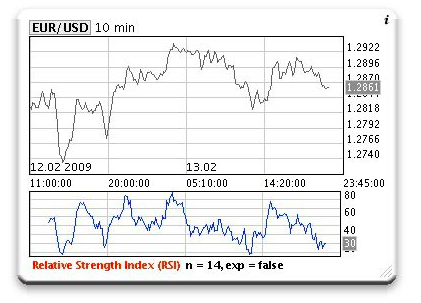
Chris Craig designed the Forex Charts Widget v1.7. You can download it for free from Softpedia. It is a downloadable chart system that helps users to examine currency charts for multiple pairings. The user will be able to select a time period and use a set of indicators included in the plug-in.
#2 Online Charts
These charts are majorly web-based that is accessible through the websites of some software providers and brokers. In terms of interaction and tools required to use them, these charts don’t provide a lot of versatility. It is not advised that you utilize internet charts for binary options trading.
The following are some of the charting sources for online-based charts that are used in binary options analysis:
- My FX Dashboard (by OFX)

OFX’s binary charting tool allows traders to perform line studies, employing indicators, and more. This program is a Java-enabled internet application that allows users to move between simple and sophisticated charts. This charting software is written in EasyLanguage, the same programming language that drives FXCM’s TradeStation trading platform. Thus it can be used as a software plug-in on FXCM’s main trading platform.
- FreeBinaryOptionsCharts.com

This website provides a free and simple binary options chart. They also offer you a fantastic beginner’s guide on using binary charts. The strategy articles offered are of very high quality, the reason being it is a Mifune’s Site.
How to read Binary Options charts?
#1 Essentials
If you’re trading binary options on the EUR/USD, you should open a chart and utilize the tools to help you make smarter trading selections. Input the asset symbol or name to view how the price is going now and in the past if you’re trading a binary options asset.

(Risk warning: Your capital can be at risk)
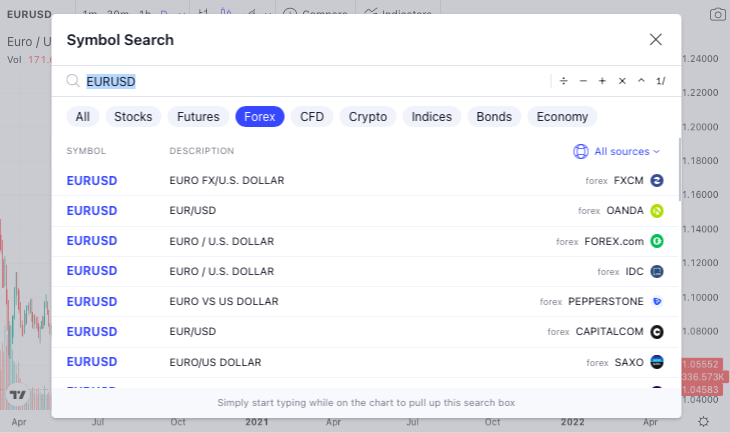
#2 Choose an asset
In the upper left box, type the name or symbol of the asset you’re trading.
And as soon as you begin typing, a dropdown list displays, making it extremely simple to locate the asset you want.
#3 Choose a time frame
A pull-down menu is located next to the symbol box. This option is set to “Daily” by default which will display your asset’s daily price history. Each bar represents one day, making this a useful time period for determining an asset’s overall price trend.
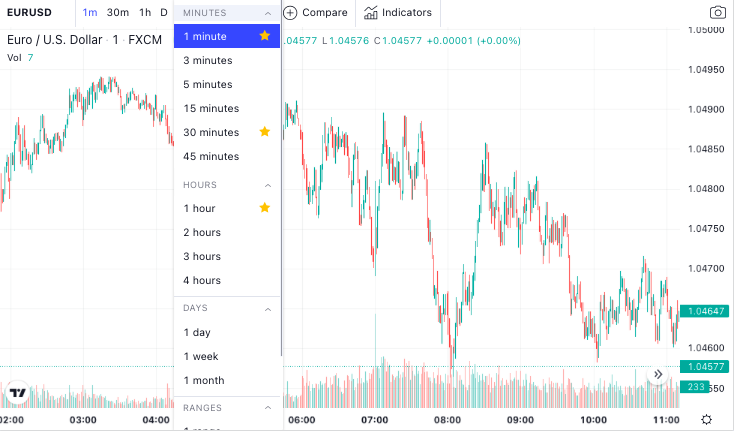
You’ll also want to look at how the asset’s price has behaved over a short timeframe if you’re day trading or trading short-term binary options. You may zoom in to check how the price is behaving right now by choosing a shorter time window, such as a minute, 5 minute, or 15-minute display.
Each bar on the chart will show 5 minutes of price data if you choose “5 Minute.”
#4 Tool to compare
If you wish to compare two or more assets, the Compare tool is ideal. When you examine the chart patterns of different assets, you will see which ones are weaker and which ones are stronger, which will guide you to select which assets to buy, put or call in.
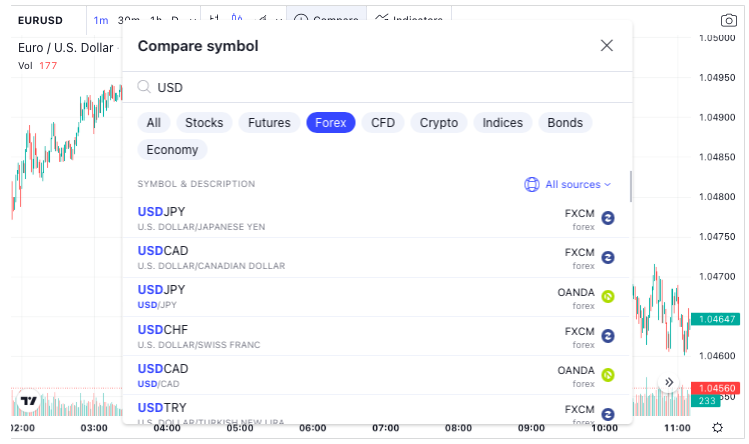
After selecting “Compare,” enter the symbols you’d want to compare to the asset currently displayed on the chart.
Because the assets have various values, the scale along the right represents a percentage and not a dollar value. You may use the % scale to see whether an asset(s) is performing better or worse in terms of percentage changes.
If you don’t like the % scale, deselect it from the Compare tool’s “Show Percentage Scale” option. Return to Comparison and deselect or erase the assets from your comparison list to stop comparing.
#5 Technical indicators
You need simply select “Technical Indicators” from the dropdown menu that appears, and the indicator will be added to your chart when you select it. Each indicator is fully configurable. In most cases, you’ll choose to add the indicator to the price history, so when it asks where you would like to implement it, select “Price History.”
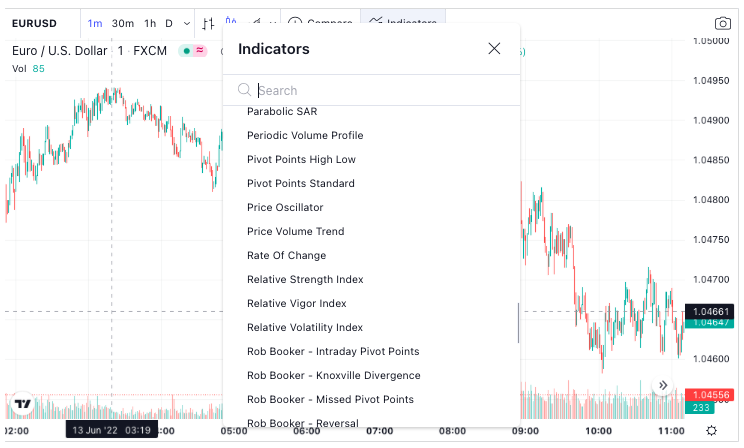
All of the indicators you’ve added will be shown at the end of the price chart or in the pricing data. To personalize the indicator, select “Edit” from the tiny arrow beside the indicator name.
#6 Zoom in or out
By dragging the grey sliders at the bottom of the chart to the right or left, you may quickly zoom in and out on the time frame you’re observing. You may also use these sliders to go back in history and zoom in on a certain day in the past.
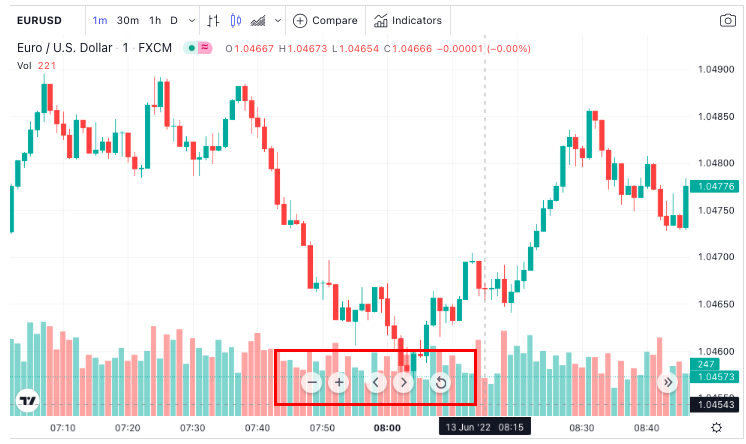
You may simply change your overall time period by tapping on one of the grey bottoms at the bottom, like 1D (1 day), 6M (6 months), 1Y (1 year), or YTD (year-to-date).
#7 Settings
Finally, click “Chart” in the top right to modify the general configuration. Except for the first setting, which you will have to modify on the basis of your personal tastes, you don’t need to bother about the other settings.
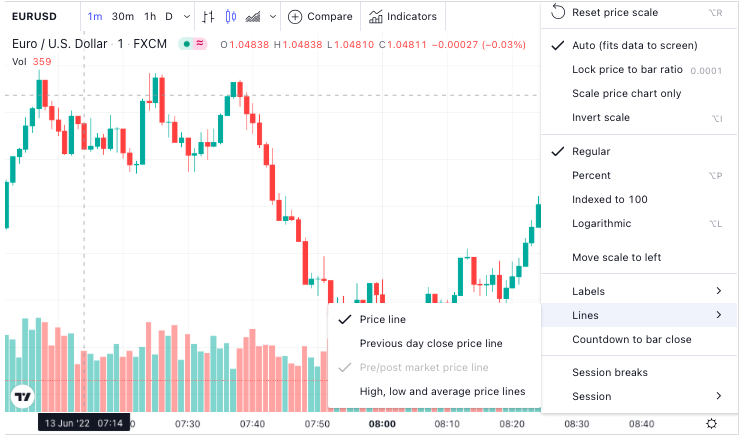
Candlestick is the default setting for “Price Style.” For many traders, candlestick charts are the favored chart type. You may also choose from the OHLC (OpenHighLowClose) chart, Line Chart, and Bar chart if you want a different style of chart. All of these charts provide price history, but they do it in different graphical ways, and some include more data than others.
Conclusion: Charts enable a more strategic way of trading
While binary options charts may be highly beneficial in establishing entry opportunities for binary options traders and providing important insight into an asset’s past performance, they must be thoroughly understood before they can be effectively utilized. It’s also crucial not to allow your emotions to get the best of what the charts are telling you. Never let your emotions convince you that a big negative trend in the moving averages is insignificant, such as a downward cross. As a trader, you must pay attention to the indicators since they tell a history.
When done correctly, charting may be quite profitable, but you must first educate yourself and choose the patterns and technical indicators you want to utilize in your trading approach. There are few ‘right and incorrect’ answers once it comes to the chart since each trading technique is as unique as the person who uses it. Demo accounts are a wonderful opportunity to experiment with different trading strategies and see what works for you.