One can quickly perform binary options trading as it depends on the simple proposition of yes or no. Traders can determine the proposition by understanding the market, keeping themselves up to date with the financial news, and spotting price trends.
But how can one predict the market movement of binary options as it’s volatile in nature? The answer is technical indicators. Trading indicators can be seen as the mathematical value used on graphs and charts to understand market patterns.
Technical indicators help a trader get a better idea of the market so that they can enter or exit the trade with huge profitability. The indicators are divided into four categories, i.e., momentum, volatility, trend, and volume.
You can easily find a technical indicator for yourself as there are plenty of options available. However, if you want to use an indicator that can help you predict future price reversal, Fibonacci Retracement should be your pick.
This indicator is not for everyone. However, if used correctly, one can accurately predict the future price movement of an asset.
But is this trading tool foolproof? What are its drawbacks? And how can it help with binary options trading? Well, to find the answers to these questions and more, you can continue reading this post.
What you will read in this Post
What is the Fibonacci Retracement tool?
Fibonacci Retracement is a robust technical analysis tool that is generally used for understanding the nature of the binary options market. This technical indicator is just as much functional as MACD and moving average indicator.
One thing that makes the Fibonacci Retracement tool special is its history. This tool is based on thousands of years of mathematical observations. With the help of this tool, traders can predict the areas of support and potential targets for resistance.
Lately, Fibonacci Retracement has become a popular tool among traders as it helps to develop a simple and easy binary options trading strategy. Using this indicator, any trader can track an asset or binary options price through a price versus time chart.
What are different Fibonacci Retracement levels?
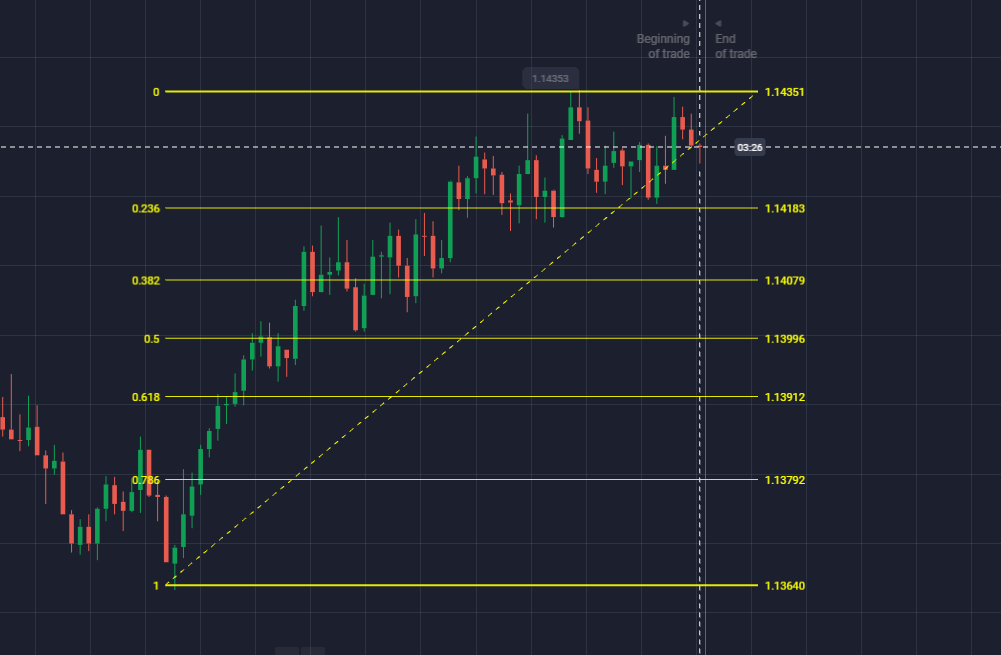
Fibonacci Retracement levels are represented in horizontal lines on the chart. These lines represent the support and resistance level on the chart. The levels are derived from the Fibonacci sequence, and they are represented in percentage.
Here, the percentage indicates how much of a prior move the price has retraced. The six levels are 23.6%, 38.2%, 50%, 61.8%, 78.6%, and 100%. Besides this, 50% is also a Fibonacci ratio. However, it is not officially approved. These percentages help a trader to know about the areas on the chart where the price of an asset will reverse or stall.

Traders can use the Fibonacci Retracement indicator to draw between two significant price points, say low and high, of an asset. After this, the indicator creates a level between the two price points.
For example, the price of an asset increases by $10, and then it drops by $2.36. By this, you can conclude that the price has been retraced by 23.6%. Fibonacci Retracement is also used to determine the stop loss level, place entry orders, and set price targets.
How to calculate Fibonacci Retracement levels?
Well, there is no given formula for calculating Fibonacci Retracement level. But you can calculate the position by choosing two extreme points. After that, you are required to draw a line that joins these two points.
The joining line is called the trend line because it shows the price trend between two points. Other lines can be drawn when the percentage moves.
For instance, the price of an item moves from $10 to $15. You can use these two points for drawing a retracement indicator. Now, to calculate 23.6% of the item, you need to do a quick calculation.
$15 – ($5 x 0.236) = $13.82
After this calculation, as a trader, you can conclude that the 23.6% level of the item will be at the $13.82 price level.
How can Fibonacci Retracement help with Binary Options trading?
For using Fibonacci Retracement, traders must draw percentage lines on the chart. These lines help in predicting where the price changes will occur in the market. This data can help you speculate when you must purchase or sell binary options.
There are three rules that traders must remember while using the Fibonacci Retracement tool.
- Fibonacci Retracement level should not be seen as a signal. That’s because it’s the level where the signal is likely to occur in the binary options trading market.
- Signals that occur at one of the retracement percentages are better than those at other levels. But sometimes, a strong signal also occurs between two lines.
- If the retracement level in the trading chart is broken even once, the target shifts to the following retracement level. If the move is stronger than the previous level, the move will continue in the same direction.
(Risk warning: Your capital can be at risk)
How to use Fibonacci Retracement levels?
To gain more profitability from the Fibonacci Retracement tool, you can remember a few things.
- You should trade strongly trending financial instruments like gold, EURUSD, and more.
- Use an accurate time frame like a daily chart.
You can also analyze the prior price movements to understand the nature of ma. For instance, if you calculate the price rise of an item from bottom to top to calculate retracement level. The measured level can help you understand the retracement of price when it continued to move upward after rising.
Similarly, you can calculate the price fall from top to bottom to know the retracement level. This level indicates the retracement of an asset’s price when it continued to move in the downward direction after falling.
The traders of uptrend direction use buying patterns. Likewise, the traders of the downtrend direction use the selling pattern.

Is Fibonacci Retracement tool foolproof?
Although Fibonacci Retracement is an excellent way of knowing the price movement of an asset, it is not foolproof. That’s because it has certain limitations.
If a new trader uses the Fibonacci Retracement tool to understand the binary options market, they will likely use the data and lines as shown in the chart. However, an experienced trader would always adjust the lines to find out accurate information.
Additionally, the binary options market is volatile. So, it becomes almost impossible to predict an asset’s exact situation or price movement. And when traders use such data, they are likely to lose the money they have invested in trading.
Furthermore, the Fibonacci Retracement level doesn’t identify the exact turning point of price in the market. While you might get estimated information, you can’t mistake it for the exact price points.
Not to mention, the entire concept of Fibonacci Retracement is based on numbers and calculations. While the calculation is generated based on the Fibonacci percentage, there is no logic.
Because of lack of logic, Fibonacci Retracement becomes a complex indicator for traders who looks for reasoning in their trading strategy.
Broker Tools
Without a doubt, Fibonacci Retracement is an excellent way of determining the price of an asset. However, the calculations, numbers, and ratios can make a trader overwhelmed.
But you can use a powerful broker tool that comes with advanced charting software to make all the calculations work easy and quick.
Here are some popular brokers that offer Fibonacci chart patterns.
Quotex
If you are looking for a trading platform with a lower minimum deposit amount, Quotex should be your pick. It requires a minimum deposit of $5. After depositing the money, you can get access to a demo account.
While trading with Quotex, you can expect a payout rate of 98%, which is the highest payout rate offered by any options trading platform. However, this broker is not legally registered.
(Risk warning: Your capital can be at risk)
IQ Option
IQ Option is a well-known binary options trading platform that CySEC regulates. This reliable broker needs a minimum deposit of $10. Once you have made the deposit, you can start trading with IQ Option using Fibonacci chart patterns.
After depositing the minimum amount, you can also get access to the demo account. And the payout rate offered by IQ Option is 90%.
(Risk warning: You capital can be at risk)
RaceOption
RaceOption is another trading platform that you can use for investing your money in the binary options market by using Fibonacci chart patterns. The platform was launched in 2014, and it offers a payout rate of 90%.
The minimum deposit needed to trade from RaceOption is $250. While the amount is a little high, it’s worth it because this broker offers access to three different trading platforms based on the amount that you have paid.
(Risk warning: You capital can be at risk)
Conclusion
Fibonacci Retracement is a popular trading tool that multiple traders use for analyzing the binary options market. Using the Fibonacci lines, traders can get an idea of the price trend of an asset.
However, one must not entirely depend on this data because it does not tell about the exact turning point of an asset’s price in the market. Also, this indicator has certain limitations that traders cannot overlook.
But all in all, Fibonacci Retracement is an excellent tool that can help you to reach your trading goals.

